Interactive Maps for Transparent City Budgets
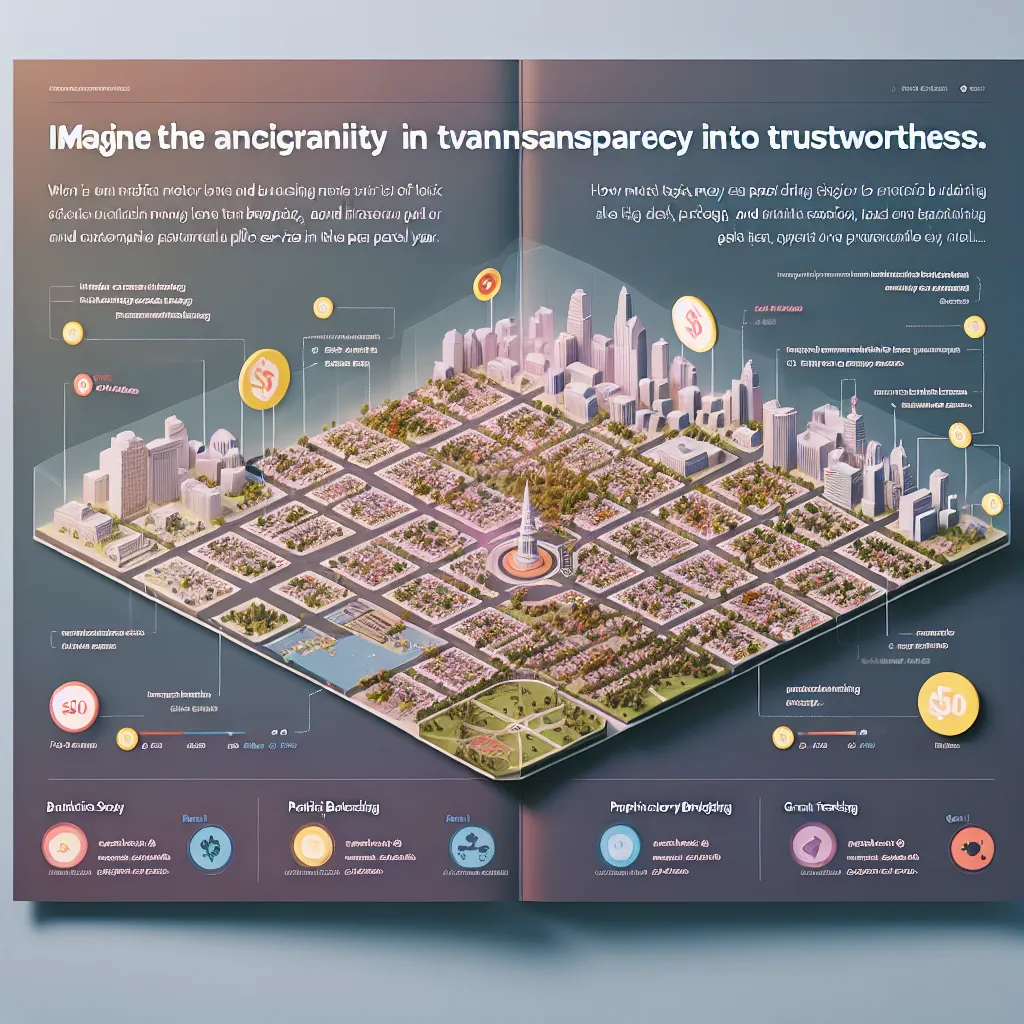
Civic budgets are black boxes. Most residents—and even many staff—don’t know where tax dollars actually go. BudgetMap turns municipal budgets into interactive, geospatial maps with visual overlays for streets, schools, parks, and departments. Click a neighborhood and see how much was spent last year on trash pickup, repairs, and public safety. Think “Google Maps for city spending.” Built for transparency and trust, with plug-ins for participatory budgeting and grant tracking. In an election year, tools like this can turn fiscal black holes into citizen trust engines.
Description
No additional description provided.
The Pitch
In towns and cities around the globe, municipal budgets often remain a mystery. While local governments allocate millions of taxpayer dollars annually, many residents—and even some municipal staff—lack insight into how these funds are distributed and utilized. This lack of transparency not only fosters distrust but also diminishes civic engagement. To bridge this gap, we propose BudgetMap: an innovative solution designed to demystify city budgets and enhance community involvement.
**Backstory**
For decades, municipal budgets have been released in lengthy, complex documents filled with jargon, making them inaccessible to the average resident. Community meetings are often held in the interest of transparency, but low attendance reflects an ongoing disconnect between citizens and their understanding of local financial decisions. As urban areas grow and demand more from their public services, residents increasingly seek to understand and influence how funds are spent in their communities.
**Problem**
1. **Lack of Transparency**: Many residents are unaware of how their tax dollars are allocated across public services. 2. **Limited Public Engagement**: With budget details shrouded in complexity, civic involvement remains low. 3. **Inefficient Resource Allocation**: Without clear insight into budgeting, inefficient spending goes unchecked. 4. **Trust Deficit**: The opacity of financial information breeds skepticism and erodes trust between the public and their governing bodies.
**Solution**
BudgetMap aims to address these challenges by transforming static budget documents into dynamic, interactive visualizations. By integrating geospatial technology, BudgetMap will illustrate budget allocations and expenditures across neighborhoods, making municipal finances more accessible and understandable.
**Product Details**
- **Interactive Maps**: Municipal budgets are converted into dynamic geospatial maps that provide visual overlays for infrastructures such as streets, schools, parks, and departments. - **Drill-Down Data**: Users can click on specific neighborhoods to access detailed insights into spending on services like trash collection, street repairs, and public safety. - **Participatory Modules**: Tools for participatory budgeting allow residents to propose and vote on project allocations. - **Grant Tracking**: Track the allocation and impact of grants within communities. - **User-Friendly Interface**: Intuitive and accessible design to cater to users with varying levels of tech-savviness.
**Tools for MVP Launch**
- **Mapping Technology**: Utilize platforms like Mapbox or Google Maps API to build the interactive map interface. - **Data Visualization**: Tools like D3.js or Tableau for presenting financial data in compelling visual formats. - **Backend Development**: Use Node.js or Django for secure data management and processing. - **Frontend Framework**: React or Angular for building a responsive, user-centric interface.
**Go-To-Market Strategy**
- **Partnerships with Municipalities**: Collaborate with local governments to pilot the platform, demonstrate transparency, and drive community engagement. - **Community Workshops**: Host sessions to educate residents on how to use BudgetMap and encourage participatory budgeting. - **Digital Campaigns**: Leverage social media and digital platforms to reach tech-savvy constituents and promote civic engagement. - **Press Releases and Media Coverage**: Generate buzz through local news outlets and urban planning publications.
**Business Model**
- **Subscription Model for Municipalities**: Offer tiered subscriptions based on city size and additional features required (e.g., participatory budgeting plug-ins). - **Consulting Services**: Provide customization and integration services for cities adopting the platform. - **Freemium Access**: Offer basic features for free to encourage initial adoption, with advanced analytics available through paid plans.
**Conclusion**
By converting opaque financial reports into user-friendly visualizations, BudgetMap will empower communities, enhance transparency, and foster trust in local governments. Our solution promises to turn fiscal black holes into engines of citizen engagement and accountability, setting a new standard for open governance in the digital age.