Income Streak Tracker: Visualize Your Earnings Daily
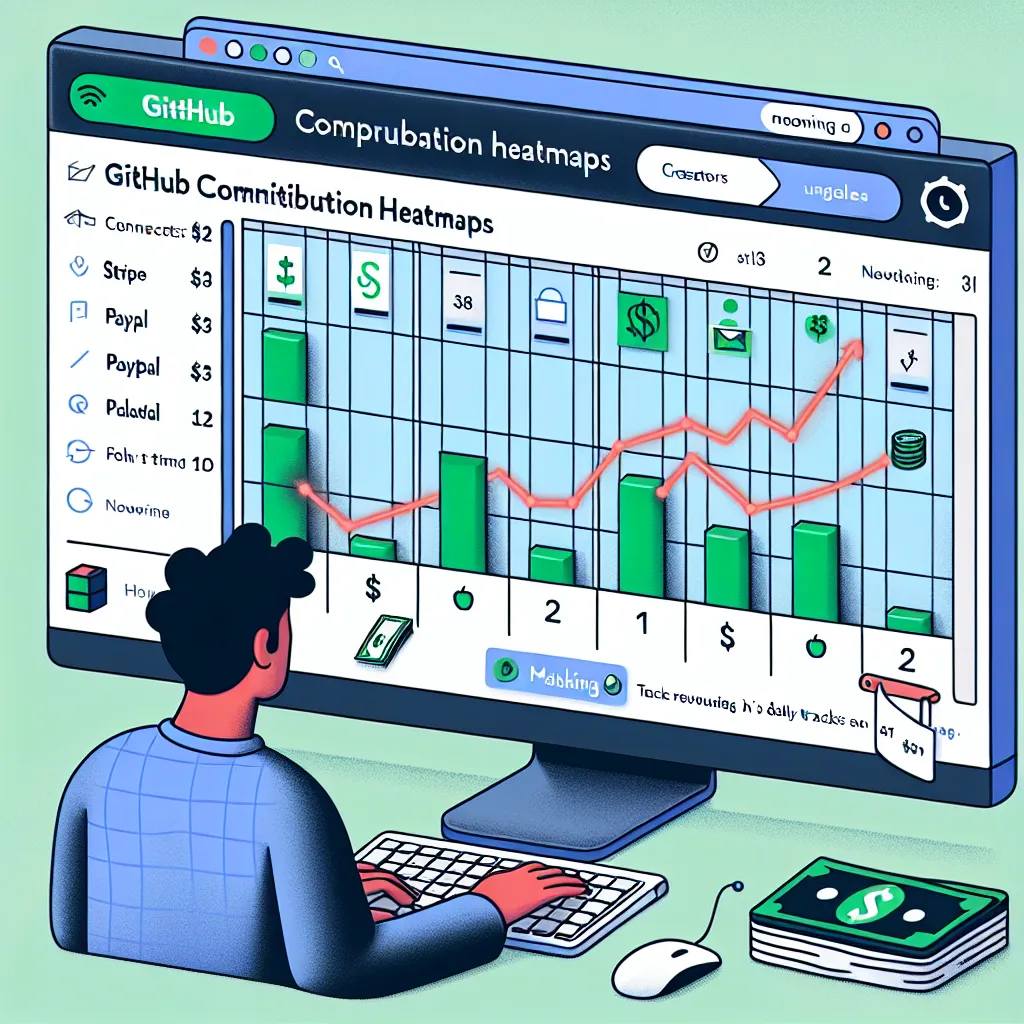
Developers love their GitHub contribution heatmaps. It’s a visual streak of productivity. But there’s no equivalent for tracking your earnings — whether from freelancing, investing, or startup revenue. This tool connects to Stripe, PayPal, and Plaid to show your income on a daily grid like GitHub’s. It tracks revenue streaks, lets you set goals, and shows charts over time. With the rise of solo creators and indie hackers, money has become a stat to optimize — and visualize. For example, a newsletter creator sees 12 green boxes in a row — she’s made sales every day for almost two weeks. It keeps her motivated to keep shipping.
Description
No additional description provided.
The Pitch
For many developers and tech enthusiasts, GitHub's contribution heatmap serves as a daily motivator, visually representing their streak of productivity. However, this form of tracking is largely absent in other crucial areas of life, particularly in financial earnings. Whether you're a freelancer, investor, or indie startup founder, visualizing your earnings can be just as motivating and beneficial as tracking code contributions.
Backstory
With the rise of solo creators, freelancer culture, and indie hackers, the landscape of work is changing. More individuals are taking the leap into entrepreneurship, be it through freelancing gigs, investing, or starting their own ventures. These people thrive on data-driven insights to continually improve their skills and outputs. However, when it comes to personal income or business revenue, most solutions lack a convenient way to visualize earnings consistently.
Problem
The current platforms that freelancers and creators use for revenue generation, such as Stripe, PayPal, or bank accounts connected via Plaid, provide raw data but lack a coherent visualization of daily and long-term income. Without a straightforward way to track and visualize financial streaks, it becomes difficult to stay motivated and set actionable milestones for individual or business growth.
Solution
The solution is an income visualization tool inspired by GitHub's heatmap, tailored to individuals who earn from various channels like freelancing, content creation, or small businesses. This tool will sync with payment platforms like Stripe, PayPal, and Plaid to display daily earnings in a visually appealing grid. Users can identify their income streaks, set revenue goals, and access historical data to observe trends over time.
Product Details
1. Integration: The tool will seamlessly integrate with popular financial platforms such as Stripe, PayPal, and Plaid, ensuring a comprehensive view of all income sources.
2. Daily Grid: Much like GitHub's heatmap, users will see a daily grid that fills in with different colors based on the day's earnings, offering immediate insights into productivity streaks.
3. Goal Setting: Users will have the option to set short-term and long-term financial goals, track progress, and receive motivational alerts when they hit milestones.
4. Analytical Insights: The tool will provide detailed charts and analytics, showcasing trends in earnings, highlighting best-performing days or months, and assisting with income forecasting.
5. Customization: Users can customize their visual display, selecting color schemes or focusing on specific income streams.
Tools for MVP Launch
- Frontend Development: React or Vue.js for a responsive and interactive user interface. - Backend Development: Node.js or Python (Django/Flask) for a robust backend. - Payment Integrations: Use APIs from Stripe, PayPal, and Plaid to fetch transaction data. - Data Visualization: D3.js or Chart.js to create dynamic and interactive data visualizations. - Deployment: Platforms such as Vercel or Heroku for quick deployment of the web application.
Go-To-Market Strategy (GTM)
1. Early Access: Launch a beta version and invite a select group of freelancers and creators to use the tool, gathering feedback to iterate and improve.
2. Community Engagement: Partner with freelancer platforms, online creator communities, and tech forums to raise awareness and gain user traction.
3. Content Marketing: Publish blog posts, success stories, and case studies highlighting the tool’s unique features and benefits on platforms like Medium and LinkedIn.
4. Social Media Campaigns: Use targeted campaigns on platforms like Twitter and Instagram, focusing on creators and digital nomads who could benefit from visualizing their earnings.
Business Model
1. Freemium Model: Offer core features for free, encouraging widespread adoption. Introduce premium subscriptions with advanced analytics, personalization options, and enhanced goal-setting features.
2. Tiered Pricing: Provide different pricing tiers based on user needs, such as solo creators, small teams, or businesses, with added functionality at higher tiers.
3. API Access: Offer API access for larger users or platforms that wish to integrate the tool's capabilities into their own systems for a recurring fee.
Conclusion
This innovative earnings heatmap provides a new level of motivation and insight for the modern-day freelancer and creator. By visualizing income streaks and offering in-depth analytics, this tool empowers individuals to make informed financial decisions and continuously strive for growth.