Episodic Content Loyalty Analytics Dashboard Innovation
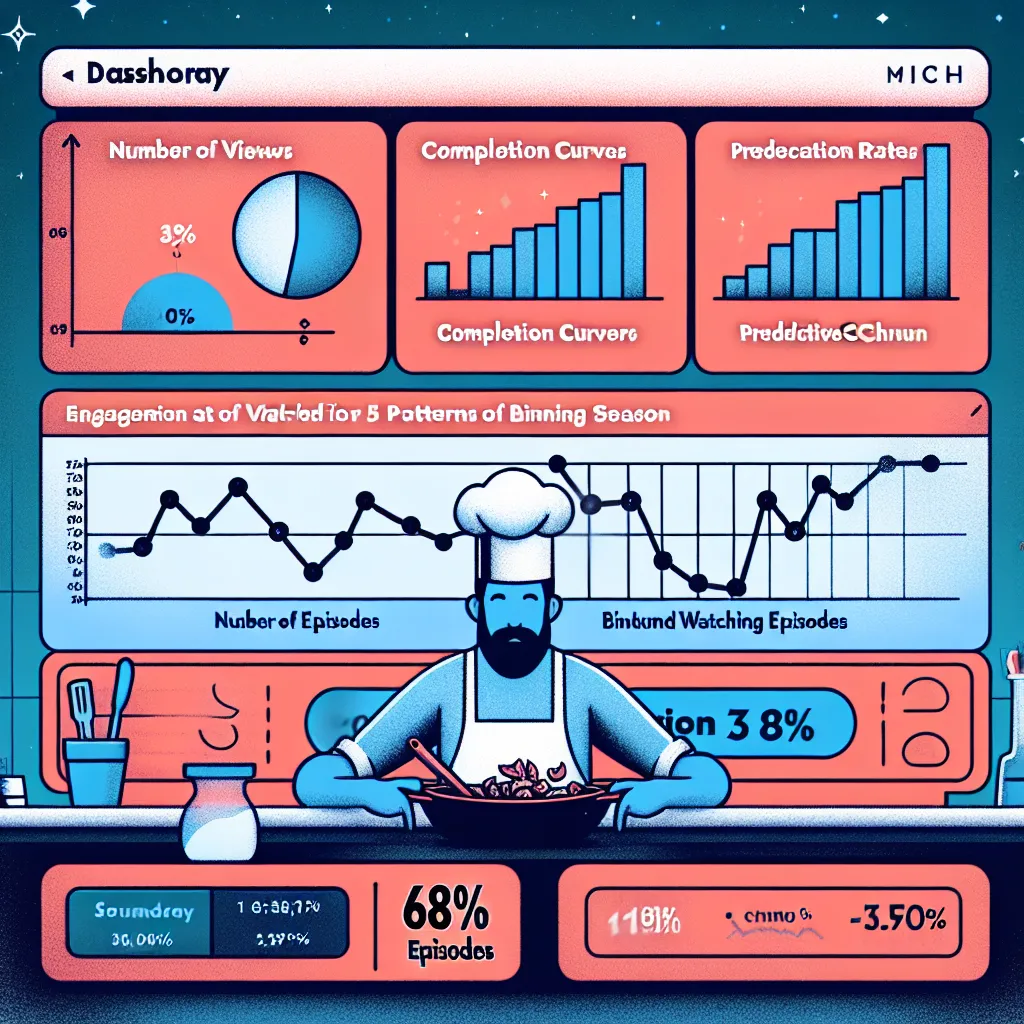
Marketers still obsess over reach—but episodic content is about return. Right now, there's no analytics layer that helps brands or creators measure loyalty over time: Are people watching all 6 episodes? Coming back weekly? Sharing after episode 3? This startup would be a “loyalty analytics” dashboard built for episodic content. It goes beyond views to track completion curves, multi-episode engagement, binge behavior, and even predictive churn. Think Mixpanel meets YouTube Studio for shows. It helps brands prove not just that people watched—but that they cared. The trend: as brands evolve from ads to content slates, they need to justify investment through repeat engagement, not just impressions. Example: A CPG brand sponsors a 5-part cooking show and uses this dashboard to prove 68% of viewers watched all episodes—unlocking budget for a second season.
Description
No additional description provided.
The Pitch
In the evolving landscape of digital marketing, brands are increasingly shifting from traditional advertisements to creating engagements through episodic content. Yet, a compelling challenge persists: determining the depth of audience engagement beyond basic view counts. Traditional analytics tools fall short in providing insights on viewer loyalty and engagement over time, leaving brands and content creators in the dark about the true impact of their content.
### Backstory
As digital content consumption continues to skyrocket, brands are venturing into creating their own branded shows, series, and webisodes. These endeavors require significant investment and strategic thought. Despite robust reach in terms of views, brands struggle to quantify the value delivered by these series in terms of audience loyalty, engagement consistency, and overall effectiveness. The existing metrics system is largely inadequate in capturing the nuances of episodic content, such as viewer retention across episodes or predicting which viewers are at risk of dropping off.
### The Problem
Current analytics platforms primarily focus on single-metric outputs such as the number of views or basic demographic insights. This vanilla approach fails to satisfy the demand for deeper insights, particularly those needed to capture viewer loyalty and long-term engagement in episodic formats. Brands lack tools to comprehensively measure whether audiences are not only watching but engaging deeply—coming back for more episodes, talking about it online, and sharing with peers. Consequently, they face challenges in justifying further content production investments to stakeholders.
### The Solution
Introducing a comprehensive loyalty analytics dashboard tailored specifically for episodic content. This innovative tool moves beyond views to explore engagement metrics that matter for episodic endeavors. It captures completion rates, tracks multi-episode engagement, analyzes binge-watching behavior, and even predicts churn rates. The tool acts as an insightful platform where brands can prove that their audience is not just engaging with the content but genuinely interested in its entirety.
### Product Details
1. **Completion Curves:** See how many viewers finish each episode and track drop-off points. 2. **Multi-Episode Engagement:** Analyze how many viewers come back for subsequent episodes. 3. **Binge Behavior Analysis:** Identify and segment viewers who consume multiple episodes in one go. 4. **Churn Prediction:** Utilize AI to predict potential viewer drop-offs and strategize re-engagement efforts. 5. **Engagement Heatmaps:** Visual representations of the most engaging parts of each episode. 6. **Social Sharing Metrics:** Track which parts of the shows are shared most frequently on social media.
### Tools for Launching as an MVP
- **Tech Stack:** Use analytics infrastructure such as Mixpanel or Amplitude for backend development. - **Front-End Development:** Employ frameworks like React or Angular for an intuitive dashboard design. - **Data Analytics:** Integrate machine learning models for predictive analytics through Python or R. - **Cloud Services:** Host on AWS or Google Cloud for scalability and reliability. - **User Feedback Surveys:** Employ tools like Typeform or SurveyMonkey for continuous user feedback collection.
### Go-to-Market (GTM) Strategy
1. **Target Audience:** Initially focus on digital content creators, media agencies, and brand marketing teams. 2. **Beta Launch:** Release a beta version to a select group of influential users to gather insights and build credibility. 3. **Partnerships:** Collaborate with content platforms to integrate seamlessly with existing distribution channels. 4. **Thought Leadership:** Publish whitepapers and case studies demonstrating the unique insights the tool provides. 5. **Advertising:** Leverage social media and digital ads targeting decision-makers within content-driven organizations.
### Business Model
- **Subscription-Based Model:** Offer tiered subscriptions allowing access to varying levels of analytical depth and user accounts. - **Freemium Model:** Provide a basic free version with essential metrics, encouraging upgrades for detailed analytics. - **Per-Usage Pricing:** Allow pay-per-use options catered to brands that want specific campaign analysis without a long-term commitment. - **Enterprise Licensing:** Offer tailored solutions for large companies seeking comprehensive analytics across multiple content verticals.
By focusing on these components, we aim to build a robust platform that not only meets the current needs of content marketers and creators but sets a new standard for evaluating and enhancing episodic content strategies.